


2Department of Radiation Oncology, Balikesir Atatürk City Hospital, Balıkesir-Türkiye
3Department of Radiation Oncology, Bursa Medicana Hospital, Bursa-Türkiye
4Department of Radiation Oncology, Bahçeşehir Memorial Hospital, İstanbul-Türkiye
5Department of Radiation Oncology, Koru Hospital, Ankara-Türkiye
6Department of Radiation Oncology, Kocaeli University Hospital, Kocaeli-Türkiye
7Department of Radiation Oncology, Bursa City Hospital, Bursa-Türkiye
8Department of Radiation Oncology, Manisa City Hospital, Manisa-Türkiye
9Department of Radiation Oncology, Eskişehir City Hospital, Eskisehir-Türkiye
10Department of Radiation Oncology, Ankara Memorial Hospital, Ankara-Türkiye
11Department of Radiation Oncology, Yedikule Chest Disease Hospital, İstanbul-Türkiye
12Department of Radiation Oncology, Vehbi Koç University Hospital, İstanbul-Türkiye
13Department of Radiation Oncology, Çam and Sakura City Hospital, İstanbul-Türkiye
14Department of Radiation Oncology, Yeni Yüzyil University Hospital, İstanbul-Türkiye DOI : 10.5505/tjo.2023.4115
Summary
OBJECTIVEThe objective of the present study was to assess the impact of detector type on measurements of small fields for the 6MV-FFF beam within 13 institutes of Elekta Versa HD linear accelerator users.
METHODS
Using various ion chambers, measurements of the percent depth dose (PDD), off-center ratio (OCR),
and output factor (OF) datasets in square areas between 2×2 and 50×50 mm2 for beam modelling in
Monaco TPS were collected, and dosimetric differences were compared. The types of used detectors
were PTW PinPoint 31014, IBA CC04, IBA CC01, IBA CC13 and Exradin A16, respectively. The effect
of the detector type on the OCR was evaluated by including penumbra width of fields, full width half
maximum value (FWHM) and FFF beam specific unflatness value. The PDDs were compared using
depth of dmax, d5 and d10. Also, the differences between OFs of each field and institution were analyzed
with and without correction factor.
RESULTS
The largest observed variance in dmax was 3 mm for a few institutions, whereas the majority of institutions
agreed with GBD dmax values within 2 mm. The agreement of the median PDD values with GBD was all within ±2%. The maximum deviation was under 2% for the shoulder part and 1% for the center
part of the OCR profiles for all field sizes. The maximum deviation of the penumbra and FWHM
value observed for all field sizes at certain institute OCR data was considered a user-dependent effect
instead of a detector. The relative percent difference both the OFuncorr and the OFcorr compared with
GBD for all field sizes was within ±3%.
CONCLUSION
The findings of this study obtained via a large multicentre study can be considered as an external crossverification
for Versa HD users doing beam data collection of Monaco and should help to offer accurate
TPS modelling of small fields and minimize the uncertainty of SRS and SBRT. Our results emphasized
that the use of several dosimetric systems, comparison of golden beam data, and multi-institutional
review are required.
Introduction
Dosimetric accuracy in advanced radiation techniques such as stereotactic radiosurgery (SRS), Intensity Modulated Radiation Therapy (IMRT), and Volumetric Modulated Arc Therapy (VMAT) depends on the accuracy of small field dose measurements, especially for the determination of field output factors (OF) which is the most effective factor to calculate the dose accurately during beam data submission to treatment planning system (TPS) since the delivery of the planned complex dose distribution is to able to deliver to the patient with segmented small fields. Accurate small field dosimetry is the most challenging part of beam data measurements for modelling a TPS because the beam and detectors caused dosimetric challenges. The accuracy of dose measurements including scanning and point dose measurements in small fields could be affected by the electron source size of the machine, overlapping of penumbra regions, loss of the lateral charged particle equilibrium (LCPE), non-tissue equivalence of the ion chamber's active volume, and the finite size of the detector.[1-4] In addition to the accurate measurements of OFs for small field sizes, Percent depth-dose (PDD) and off-axis ratio (OCR) obtained from cross profiles curves for multiple field sizes and depths measured in mostly water tanks using an appropriate ion chamber are required to create a beam model for commercial TPSs.Recently, the International Atomic Energy Agency (IAEA) published a new formalism for practice[2] on small static fields used in external beam radiotherapy that the output correction factor was suggested to account for possible changes in detector response of ion chamber reading of output measurement to obtain the corrected output ratio. On the other hand, the measurement of the percentage depth dose (PDD) in small beams may vary up to %11 discrepancies toward the smallest fields because of the difficulty of keeping the detector center on the beam axis, energy dependency, and volume averaging effect of the detector used during PDD measurements.[5-8]
The use of IMRT and VMAT does not require a flat beam profile the modulated beams by the multileaf collimator (MLC)s were used for the required homogenous dose distribution at the planning target volume (PTV) as well as inhomogeneous dose distribution when desired. Therefore, the use of flattening filter-free (FFF) beams of linear accelerators with available high dose rates by removing the flatting filter is becoming more useful in many MUs per fraction treatment techniques to be shortened treatment delivery times such as SRS and stereotactic body radiotherapy (SBRT). The Agility MLC system of Versa HD (Elekta Oncology Systems, Crawley, UK) linear accelerator (Linac) comprises 160 leaves with a width of 0.5 cm at the isocenter and supports 6MV-FFF photon beam with dose rates of 1400 Monitor Units (MUs) per minute (MU/min). SRS/SBRT techniques planned with IMRT/VMAT require an accurate small field beam modelling using a suitable smallfield dosimetry detector with a high spatial resolution, low energy dependency and independence of dose rate either as mentioned above for flattened beams or especially for FFF beams and stability.[1,3,9-11] The dosimetric characteristics of FFF beams such as cone-shaped profile, low effective energy spectrum, and high dose rate differ from flattening filter (FF) beams were investigated by several authors regarding the advantages over FF beams.[12-14] These differences in FFF beams could result in variations in both the modelling procedure and the measurement of beam configuration data. The commissioning of Monaco (Elekta, Maryland Heights, MO, USA) Treatment Planning System (TPS) based on the Monte Carlo (MC) dose calculation algorithm for modelling Versa HD linac requires using an ion chamber in a water tank measurement of output, crossline and inline profiles, and percent depth-dose (PDD) curves for multiple field sizes down to 20×20 mm2.
In this study, we collected small fields (≤5 cm2) beam data measurements of 6MV-FFF beam including cross profiles comprising left-right and gun-target direction, PDD, and output for Versa HD linac for modelling a Monaco TPS from multiple institutions to investigate the beam data variation among the institutions and determine their dependency based on used detectors. The purpose of our work is to identify, analyze and quantify the variation among institutions and determine the effects of the ion chamber's behaviors to be observed in the scanning and OF measurements during collecting beam data for Monaco TPS modelling. Identification of these variations caused by using different ion chambers and the specific circumstances under the variations among institutions that can be observed should help medical physicists to constitute beam modelling accurately into the Monaco TPS. Although numerous authors have published experimental studies[15,16] on the response of the different detectors in small field dosimetry for FFF beams, few references on Elekta's Monaco TPS commissioning for 6 MV-FFF beam are available to evaluate the impact of the detector selection in small field beam commissioning data among institutions.
Furthermore, as recommended in the TG-106 report[17] of the American Association of Physicists in Medicine (AAPM) to verify and check the quality of the initial commissioning results, the collected beam datasets from 13 institutions were compared with vendorprovided golden beam data (GBD) for Versa HD linear accelerator. Hereby, the outcome of this multicenter investigation might be useful as a reliable secondary quality assurance (QA) dataset for beam modelling measurements comparison focusing on small-field dosimetry of 6 MV-FFF commissioning measurements performed by Monaco TPS users.
Methods
Scanning and Point Dose Measurements CollectionThe collected beam data consisting of lateral and depth dose profiles, as well as output factors from 13 institutions for 6 MV-FFF small field beam modelling in the Monaco TPS, were included in this study. All institutes measured the required measurements of 6 MV-FFF photon beam data using Versa HD linac equipped with Agility® head consisting of a MLC with 160 leaves of 5 mm thick at the isocenter. We ensured that all beam scanning and point measurement data supplied by the different institutes were conducted following the guideline for Monaco TPS beam modelling provided by the vendor. Furthermore, the beam data of each institution were confirmed to be within the manufacturer's specifications to use in clinical cases. The 6 MV-FFF beams of all institutes were calibrated using the TRS- 398 protocol[18] that 1 MU was matched to 1 cGy at a depth of maximum, Source Skin Distance (SSD) of 90 cm, and a field size of 100×100 mm2. The recommendation of the manufacturer for an optimal detector for measuring from 50×50 mm2 down to the smallest one was a microchamber. To be sure of the consistency of the 40×40 and 50×50 mm2 fields PDDs were collected using micro and an ionization chamber with a collection volume of ~0.125 cm3. Several detectors and water tank were used to acquire percent depth dose profiles (PDD), lateral profiles, and OFs for the following field sizes: 20×20, 30×30, 40×40, and 50×50 mm2 as shown in Table 1. GBD provided by ELEKTA consists of PDDs, OFs and profiles of each field sizes of 6 MV-FFF beam measured by PTW 60008 (PTW-Freiburg, Germany) shielded diode detector. The last row of Table 1 expresses the specification of the unshielded silicon p-type diode detector used for collecting GBD which is suitable to measure very precisely beam profiles even in the penumbra region of small fields and to perform accurate PDDs of especially small field sizes due to its having high spatial resolution and energy response independent of field size behavior.[19,20]
;)
Table 1: Types of used detectors and frequency of their usage for the measurements
All Scan measurements including PDDs and offcenter ratio (OCR) profiles were performed at 90 cm SSD. The profile depths were dmax of the 6 MV-FFF beam of each machine, 5, 10, and 20 cm. The chamber position correction was done to check the effective point of measurement with the following of each chamber type's specification[21] and the centering of the detector by taking profile measurements for two different depths before the PDD scans. All profiles and depth-dose curves were measured at a step size of 1 mm resolution, and step by step or continuous acquisition depending on the possibility to add a reference detector in the field without disturbance. If the resolutions of the PDDs or OCR scans were different from 1 mm, linear interpolation was calculated for the resampling of the curves. The OFs of the fields were measured at 10 cm depth and normalized to OF value of 100×100 mm2 field size without applying any correction to account for a change in detector response and shifting for the effective point.
Analysis of The Collected Beam Data
All mathematical analyses and the graphing process
were performed using GNU Octave programing language
with in-house programs code. The analysis of
the measured PDD scans with field sizes from 50×50
mm2 down to 20×20 mm2 of all institutes was done by
comparing with generated the median PDD curves using
calculated the median value at each depth to obtain
inter-institutional variability and calculating the deviation
from the GBD for respective field sizes. Because
the calculated beam modelling data of the Monte Carlo
dose calculation algorithm in the Monaco treatment
planning system could vary between institutions, the
measured beam data collected from multiple institutions
and the GBDs measured using a diode detector
were used for comparison rather than the calculated
beam modelling data of each institution. The differences
in PDDs of each institution" and the median of
the all measured PDDs from the GBD of corresponding
relevant field sizes at each depth (d) were calculated
using the following equation (1,2):
Diff(%)DD=((DDmed(d)-DDGBD(d))/DDGBD(d))×100 (1) Diff(%)DD=((DDi(d)-DDmed(d))/DDmed(d))×100 (2) where DDmed(d), DDi(d) and DDGBD(d) are the depth doses at depth (d) of the median value calculated from the depth dose graph of the multiple institutions for each data point, the depth dose value of i of institute and GBD, respectively.
All PDD were normalized at the maximum depth of the graph where the depth was accepted by the dmax value of each field size. Furthermore, PDDs at the dmax, depth of 5 cm called d5, and depth of 10 cm called d10 dose values of each field size were compared with corresponding GBD values and the median values of these depths.
The differences of the profiles in both crossplane and inplane directions at dmax and d10 depths of each institution's measured profiles from the corresponding profiles and depths of the median data and the GBD at each (x,y) coordinates were calculated for half part of the profiles using the equations (3,4):
Diff = (OCRmed(x,y,d)-OCRGBD(x,y,d))/OCRGBD(d) (3) Diff = (OCRi(x,y,d)-OCRmed(x,y,d))/OCRmed(x,y,d) (4) where OCRmed(x,y,d), OCRi(x,y,d) and OCRGBD(x,y,d) are off-axis ratio of the median profile of the institutions, i of each institute and GBD, respectively, at crossplane (x), inplane (y) and d depth coordinates. Before the calculation of the differences at any (x,y,d) position, each profile was shifted to the center of its full width half maximum (FWHM) to eliminate set-up variation among the institutions using GNU Octave programing language with in-house programs code.
Because of the combined detector and machine-related effects, measuring and deriving field size width in small fields is a challenging issue, the uncertainty of the measured radiation field widths of the institutions was investigated by comparing the FWHM of the crossline profile of the fields which scanned according to the alignment recommendations in beam modelling guide with the aforementioned detectors placed perpendicular the scan direction to minimize stem effect of the detectors. The measured OCR profiles of field sizes of 20×20, 30×30, and 50×50 mm2 with resolutions of 1mm were evaluated in terms of FWHM derived from crossline at depth of dmax and d10. The penumbral width from 80% to 20% on either side of the off-axis ratio was also compared. Furthermore, the deviation of the dosimetric field defined by FWHM and penumbra of measured OCR with various detectors from GBD has been derived by calculating with in-house code in OCTAVE math platforms.
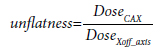
Unflatness value, which is an FFF beam-specific parameter described by Fogliata et al.[22] of OCR profile for each field size was determined using equation (5) where DoseCAX and DoseX_off_axis symbolized the dose value at the central-axis and the x position on the off-axis, respectively.
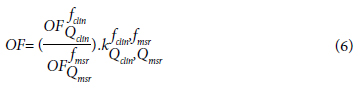
Additionally, the study assessed the impact of detector- related difficulties on output values, which were greatly impacted by small field sizes. The detector reading output values of each institution for field sizes ranging from 20×20 mm2 to 50×50 mm2 were normalized to the detector reading value of field size of 100×100 mm2. To minimize the effect of change in detector response and to evaluate inter-institutional variability, OF values were corrected using output correction factors(kQclin,Qmsr fclin, fmsr) fclin,fmsr obtained from a recently published technical report by the International Atomic Energy Agency (IAEA) and the American Association of Physicists in Medicine (AAPM) TRS-483 code of practice.[23] The correction factors of the used detectors for field sizes included in this study were summarized in Table 2. The corrected OF values for each detector obtained as defined in Eq (6) were used in the analyses where fclin was ranging from 20×20 mm2 to 50×50 mm2, fmsr was 100×100 mm2 and Q represents the quality factor of the 6 MV-FFF beam for this study. For analysis of OFs, the deviation of each institution's corrected OFs from the median value of all institutions" corrected OFs and corrected OFs obtained from the golden data provided by the manufacturer was determined for each field size for the 6 MV-FFF beam.
;)
Results
Analyses of PDD measurementsTable 2 displays the position of the maximum depth dose, dmax values for all field sizes that were included and the deviations in mm from GBD. The largest observed variance was 3 mm for a few institutions, whereas the majority of institutions agreed with GBD dmax values within 2 mm. In two institutions employing the PinPoint (31022, 31014; PTW-Freiburg, Germany) chambers for measurements, a variance of 3 mm for a 20×20 mm2 field was observed. According to the table, when the dmax values of the measured field sizes apart from 50×50 mm2 were assessed, Exradin A16 (Standard Imaging, Middleton, WI) micro ion chamber, which has the smallest volume, was prominent in its compliance within a 1mm deviation from the GBD values.
Furthermore, the percentage dose readings at 5 cm and 10 cm depths were compared with golden beam data values for PDD analyses as indicated in Table 3. The measurements performed by Institute 5 using a pinpoint ion chamber for the smallest field size, 20×20 mm2, revealed the largest variation from the GBD value, resulting in a dose discrepancy of 2.7% when %DD values at 5 cm depths were analyzed. Though the high agreement was observed at all other institutions for all field sizes, the data from institute 12 measured with CC01 (IBA Dosimetry, Schwarzen-bruck, Germany) showed variation slightly exceeding 1%, and the percentage deviations for 2×2, 3×3, and 50×50 mm2 were found to be 1.3%, 1.4%, and 1.6%, respectively. Comparing the %DD findings at 10 cm depth for the smallest region of 20×20 mm2, the maximum deviation of 4.1% was observed at the fifth institute's measurement using a pinpoint ion chamber. As previously stated, the same institute also had the highest discrepancy from GBD for the %DD value at 5 cm. While the agreement between the GBD and %DD values including all institutes except one at this depth was found to be lower than 1%, the deviation from the GBD of the 12th institute's data measured using the CC01 ion chamber was calculated to be 1.5%. The calculated deviation from the GBD for this institute was also relatively higher in other field sizes; the deviations from the GBD were at 1.8 and 2% for 30×30 and 50×50 mm2, respectively. The maximum deviation was observed to be 1.4% for %DD data of 40×40 mm2 belonging to the fifth institute that used a CC01 ion chamber for depth dose measurements submitted by 11 of the participants in 13 institutes. Except for a few data collected using Pinpoint and CC01 discussed above, which revealed deviations slightly exceeding 1%, almost all detectors were within 1% for all field sizes for depths of 5 and 10 mm.
;)
Table 3: The percentage dose values of 5 and 10 cm of PDD and variance from GBD
Figure 1 illustrates the PDD and GBD for all field sizes for each institution's measurements. The primary plots of all field sizes indicate institutional percentage differences in local dose, while the inset presents measured data.
;)
As shown in Figure 1, there were no substantial deviations in the dmax region for all field sizes, excluding form surface to build-up area, but the variations from the GBD data increased with depth. Overall PDD curves of all field sizes were evaluated, and it was observed that the deviations from the GBD reached saturation at 13 cm depth and started after the build-up zone, and the maximum variances were less than 2% and 3% with the measurements of the majority of centers up to 10 and 20 cm depth, respectively.
As can be seen in the PDD curves for each field size in Figure 1, the maximum deviation values were obtained at the institute of 5th and 12th for the 20×20 and 30×30 mm2 field sizes, and the institute of 5th for the 40×40 mm2 field size, utilizing the Pinpoint and CC01 ionization chambers, respectively. At a field size of 50×50 mm2, which is a relatively large field size according to the definition of the small field size by Das et al.,[1] the deviations from GBD increase dramatically with increasing depth, and the variation from GBD in PDDs exceeds 4% at depths greater than 10 cm in measurements performed by the seventh, ninth, and twelfth institutions by using CC04, CC13, and CC01 (IBA Dosimetry, Schwarzenbruck, Germany) ionization chambers, respectively.
Figure 2 illustrated the PDD curves of the measured and the GBD for field sizes of 20×20, 30×30, 40×40 and 50×50 mm2, respectively. As indicated in Figure 2 with the secondary vertical axis, the differences in PDD curves for all field sizes between median data that were extracted from measured data and GBD have a good agreement within 1% deviation beyond the dmax depths of each field size, with the exception of a few data for deeper depths at field sizes of 50×50 mm2 showed deviations slightly exceeding 1%. As will be detailed in the discussion section, the reason for this discrepancy in the 50×50 mm2 region is that most institutions utilize 0.125 or 0.13 cc ion chambers for PDD measurements in this area, whereas a few institutes employ small volume detectors such as Pinpoint and CC01.
;)
Analyses of OCR Profiles
The inline and crossline OCR curves were plotted at
dmax and 10 cm depth with their centers corrected to
eliminate the set up error of the measured field size
following the Monaco TPS beam modelling guide supplied
by the manufacturer and were compared with
their corresponding median and golden beam OCR
profiles. Figure 3 represents half of the crossline OCR
profiles at 10 cm depth for 20×20, 30×30, and 50×50
mm2 field sizes and the differences from the median
and GBD values. A substantial difference between the
median and GBD curves was seen in the shoulder region
for profile curves at dmax and d10 cm depths for a
field size of 20×20 mm2 obtained using non-3D pin-point ion chambers. However, it is easily observed that
the Pinpoint ion chamber broadens the profile with
overestimated data points, while the Semiflex chamber
provides underestimated data points at the crossline
profile of 20×20 mm2 field size at both dmax and 10 cm
depths. A similar result was obtained for a field size
of 30×30 mm2 that in comparison to the GBD curve,
the underestimated data from the PTW Semiflex 0.125
cc (PTW-Freiburg, Germany) volume ion chamber in
this region resulted in the acquisition of a profile curve
with a narrower shoulder profile. In contrast, a profile
curve with a broader shoulder was observed as a result
of the overestimated data from the CC01 and Pinpoint
detectors" measurements. As expected, the shoulders
of profiles taken with ion chambers A16 and CC01
were narrower when compared to crossline semi-profiles
measured at a depth of 10cm for a field size of
50×50 mm2 and GBD profiles measured with a diode
detector, whereas the shoulders of profiles taken with
Semiflex and CC13 ion chambers were wider. Meanwhile,
the median and GBD crossline OCR curves at
a depth of 10 cm for each field size are shown in the
graphs located at the bottom line of Figure 3. It can be
observed that, even though the compromise between
the median OCR curves and the corresponding GBD
curves did not match at the shoulder area as the field
sizes became smaller, the maximum deviation was under
2% for the shoulder part and 1% for the center part
of the profiles for all field sizes.
;)
Table 4 summarizes the calculated penumbra widths of the right side (80%-20%), FWHM values, and unflatness values described by Equation (5) for the crossline profiles of each field size at a depth of 10 cm, along with a comparison to the corresponding GBD values using in-house code in the MATLAB (The MathWorks Inc.) and OCTAVE (GNU) maths platforms. As shown in the first column of Table 4, the deviation increased as the field size increased when comparing the FWHM values of all cross-line profiles of each field size to the GBD in very small volume ion chambers such as CC01, 31022 Pinpoint, and A16. Comparatively, the FWHM values measured by other detectors were very close to each other and their FWHM values were 0.8, 0.8, and 1 mm for field sizes of 20×20, 30×30, and 50×50 mm2, respectively.
;)
The effect of volume averaging of these microchambers is what causes FWHM deviations to be dramatically higher than GBD values for CC01, Pinpoint, and A16. As a result of this effect, it was expected that FWHM would have a smaller measurement than GBD; however, the deviation in the FWHM value for profiles of all field sizes measured by 12 of the institute using CC01 was positive, indicating that the FWHM value was detected in a wider direction for this chamber measurement.
In order to summarize the result of FWHM for all measured field sizes, while differences of less than 1 mm were observed in measurements taken at other institutions for a field size of 20×20 mm2, -1.9 mm was calculated for the profile measured by the 31022 Pinpoint chamber. In the 30×30 mm2 area, FWHM values differed by -2.7 mm in the profiles of Institution 1, -2.9 mm in the profiles of Institution 11, and 3.3 mm in the profiles of Institution 12, while differences of less than 1mm were observed in measurements from other institutions. Finally, the result of the FWHM variation from GBD's values in 50×50 mm2 were found to be similar to the aftermentioned field sizes, with narrower FWHM values than GBD of 5.2 mm differences for institutions 1, 11, and a wider FWHM value than GBD for institution 12, respectively. The agreement between other institutions was less than 0.5 mm for the largest field sizes of 50×50 mm2.
Although the discrepancies in penumbra widths between institutions and GBD were not significantly different, the largest differences of 1.4, 1.7, and -1.4 mm occurred in the crossline profiles of 20×20, 30×30, and 50×50 mm2 field sizes measured by the CC04 and CC01, CC04, and A16 chambers, which belong to institute numbers 8 and 12 for a field size of 20×20 mm2, 8, and 11, respectively. The A16 ion chamber with the smallest volume determines the penumbra value with the minimum difference from GBD in 20×20 and 30x30 mm2 areas, as shown in Table 4. In contrast, the penumbra value measured with the A16 microchamber in the largest area of 50×50 mm2 yielded the largest difference compared to GBD, which determined the penumbra to be narrower.
The maximal deviation from the GBD in terms of the unflatness value calculated with Eq (5) for a 20×20 mm2 field size was observed to be 4.5% in the profiles taken with the 31023 Pinpoint and CC04 ion chambers from the 2nd and 8th institutes, respectively. Conversely, the profiles measured with the CC01 and A16 detectors, which have a smaller volume than the other detectors, provided the best fitting for the 20×20 mm2 area, with a 0.3% agreement. Even though the unflatness values in the 50×50 mm2 field of all institutes were found to be compatible with GBD with an agreement of less than 1%, the field size of 30×30 mm2 for the profile taken with the 31022 Pinpoint chamber revealed the largest deviation of 3.2%.
Output Factor Differences
Figure 4 demonstrates the values of the uncorrected
OF (OFuncorr) and the corrected OF with the kfclin,fmsr
Qclin,Qmsr
output correction factors derived from the TRS483[23] report and the literature[24,25] for detectors not included
in the report versus the measured field sizes by
the institutes using different detectors, which were labelled
in the graphs. The correction factors employed to minimize the detectors" effect on OF in the present
study, were presented in Table 5. The relative percent
difference between the OFuncorr and the OFuncorr of the
golden beam data for the 20×20 mm2 field size was
within ±2%, with the exception of the OFuncorr value
for institute 12 measured with the CC04 ion chamber,
which was 2.3% smaller than the OFuncorr of the GBD.
As listed in Table 6, there is an agreement with a 2% deviation between the uncorrected OFs and their relative difference from the uncorrected OFs of the GBD for field sizes >20×20 mm2, with the exception of the OF values measured using the CC04 ion chamber by Institute 6 for field sizes 30×30 mm2, 40×40 mm2, and 50×50 mm2, which have 2.3, 2.4, and 2.2% deviations, respectively.
;)
;)
Table 6: The relative percent difference between each institution's measured OFs and the GBD's measured OFs with and without output correction using the suggested correction factor for 6FFF photon energy and used chamber by TRS483 (23) and Casar B et al. and Benmakhlouf et al.[24,25]
The right upper and low columns of Figure 4 represent the corrected OFs and their relative deviation from the corrected OFs value of the GBD, respectively. Although the deviations were reduced by the suggested correction coefficients for ion chambers and field sizes, the results were similar to the uncorrected OF in that almost all field sizes were within 2% deviation from GBD values, except for OF value of the 6th institute, as found in the corrected OFs. In contrast, the smallest ion chamber in the current study was the Exradin A16 microchamber with a volume of 0.007 cc, exhibiting a maximum deviation of 2.9% after the correction was applied for a 20×20 mm2 field size while having an outstanding agreement for other field sizes.
;)
Discussion
In this study, the variability of small field dosimetry for the 6 MV-FFF beam of Elekta Versa HD users at thirteen clinics conducting a collaborative study was evaluated during the collection of beam data for the commissioning of Monaco TPS. The American Association of Physicists in Medicine (AAPM) Task Group 106 report[17] outlines recommendations for the linac commissioning process covering the proper selection of phantoms and detectors, the setup of a phantom for data acquisition, both scanning and non-scanning data, methods for acquiring specific photon and electron beam parameters, techniques for reducing measurement errors smaller than 1%, beam data processing, and detector size convolution for accurate profiles. As emphasized in TG106 Report[17] and TRS483,[2] accurate small-field measurements as input data, such as PDDs, dose profiles, and output values of beams, are necessary for proper beam modelling of treatment planning systems, particularly for SRS and SBRT applications in which narrow beams are used to modulate the fields. The challenges and uncertainties associated with smallfield dosimetry are further amplified when dealing with inhomogeneous environments, particularly in the context of SBRT for lung applications.[26] As described by Das et al.,[1] the dosimetry of the small fields which are smaller than 40×40 mm2 has several challenges including the volume averaging effect of the used detectors, the absence of charged particle equilibrium, the steep dose gradient at the edge of the small fields. Several detectors are recommended for small field dosimetry to surmount these obstacles, but none of them satisfies all the requirements for small field dosimetry.[27,28] Since the aforementioned limitations of ion chambers, such as their limited volume and central electrode materials effect, diodes and diamond detectors have been recommended for PDDs and profile scanning measurements of small field sizes.[29] Although GBD measurements used as reference data in this study were collected with a diode, diodes can exhibit overresponse at lower energies, especially with increasing depth due to beam softening; additionally, their dependence on angular, temperature, and dose rate should be taken into account. Although diamond detectors do not exhibit many of the aforementioned limitations of diode detectors, most medical physicists prefer micro ionization chambers for beam commissioning measurements due to the reason that diamond detectors are more expensive and microchamber detectors have recently become more accessible, their ability to precisely determine the field edge in profile measurements due to their small active volume, and their energy independence. In the present investigation, microion chambers were also used for collecting beam data commissioning measurements by thirteen institutions.When the DD curves are evaluated for all field sizes until the dmax value is reached, that is, after the absorbed dose with Kerma is equalized, both the inconsistency within the ion chambers and the deviation from the GBD are quite high due to the differences in the ability of the detectors to measure the surface dose as illustrated in Figure 1. Therefore, a large variation was observed in the surface doses as similar results of the Mamballikalam et al.[30] study, regardless of the field sizes and used detector types, which indicates the energy spectra as it is mostly due to low energy components including electron contamination and scattered photons emanating the head of Linac of the radiation beam. In the dmax value trend, the A16 microchamber obtained the closest agreement to the dmax value of the GBD in the smallest area (20×20 mm2), whereas the dmax values measured with CC01 and Pinpoint were inconsistent by as much as 3 mm. While the difference between GBD values and dmax values measured by each detector decreased to 1mm as the field size increased, the compatibility of the A16 chamber decreased as the field size increased to 50×50 mm2. Although Sarkar et al.[3] observed that PDD discrepancies due to polarity or stem effect when using very small active volume chambers such as Exradin A16 under specific scanning conditions could lead to the collection of inaccurate measurements, we observed the closest agreement between GBD and PDD curves measured using the A16 microion chamber, which employed a negative bias voltage, thereby reducing the polarity effect as suggested in their study.[27] As described in the AAPM report of TG 106,[17] the detector type and bias voltage applied to the microchambers during the scan affect the PDD curves; therefore, the deviation in PDDs observed in this study was a result of the characteristics of the detectors used and the increased contribution of noise to signal detection as a function of increasing depth. One of the aims of the present study is to assist and raise awareness among medical physicists who use Versa HD to avoid introducing erroneous data into the treatment planning system commissioning process by suggesting the comparison of their measured PDD curves acquired using micro ion chambers, particularly for the small fields of 6 MV-FFF beams, with both the PDD curves of GBD and the PDD curves of the present study, which includes the different effects of detector systems to determine possible detector-related errors and provides appropriate reference data with PDD curves collected from different users. Consequently, variations in PDD measurements were observed across 13 clinics when utilizing various ion chambers, with the greatest disparities typically occurring within 2% up to a depth of 10 cm. The dissimilarities from the PDD curves of the GBD of the corresponding field sizes increased as the depth increased, particularly at depths exceeding 20 cm, where the greatest deviation as large as 6.8% was detected for both institutions at a field size of 20×20 mm2. The most notable dissimilarity in the PDD curves was observed in the curves measured by institutes 5 and 12, utilizing Pinpoint 31015 and CC01 ionization chambers, respectively. The consistent observation of discrepancies in the PDD curves across all field sizes among these centers suggests that the elevated variations cannot be solely attributed to the ion chamber and that the source of the variations may rather be attributed to the setup of the water phantom or the displacement of the ion chamber from the central axis. As suggested by AAPM TG155,[31] seven major challenges to be solved for accurate PDD measurement that the one of challenges is the alignment of the microchamber axis to the beam's central axis at all depths. The observed deviation in the PDD measurements of the two centers in this study can be attributed to the misalignment of the PinPoint and CC01 ion chambers with the beam axes, as per the specifications outlined in item 3 of TG155. Furthermore, the differences between the median PDD curves of the measured data and the PDDs of the GBD from dmax up to the depth of 10 cm with 20×20, 30×30, and 40×40 mm2 field sizes were less than 1% as depicted in Figure 2, indicating that all Linacs produced equivalent beam quality. Since a few institutes use small volume detectors such as Pinpoint and CC04, the median PDD of the 50×50 mm2 field sizes displayed larger deviations, particularly at depths greater than 10 cm, exceeding 2% of the GBD.
During the measurement of the profiles, it can be difficult to accurately characterize the beam's edges, particularly for small field sizes where the beam profile rapidly falls off, with variable degrees of broadening of the beam's edges occurring as a function of the active volume of the scanning chamber. As noted in previous research,[10,32,30] the determination of penumbra through the comparison of median and GBD profiles is significantly impacted by the active volume effect of the chambers utilized. Our observations indicate similar results with mentioned studies that the Pinpoint and CC01 ion chambers exhibit a penumbra broadening effect, which influences the measured GBD profile for field sizes of 20×20 and 30×30 mm2, as compared to the measured GBD profile using a diode. Consistent with Kawahara et al.'s[10] findings, the penumbra widths in the OCR data of 13 institutions and the GBD, as presented in Table 4, were found to agree with less than 1 mm, except for measurements belonging to Institutes 2, 3, 8, 12, and 13, which scanned PinPoint chambers for field sizes of 20×20 and 30×30 mm2. The Pinpoint chambers exhibited an overresponse with the resulting spreading of the penumbra compared to the diode, due to the presence of the central electrode made of Al and the volume effect. In addition, comparing the penumbra value in the crossline profiles of each field size with the corresponding GBD for the depth of dmax of each field size and 10 cm, the A16 microchamber, which has the smallest active volume, best characterized the penumbra for field sizes smaller than 50×50 mm2, whereas chambers with a larger active volume overestimated the penumbra value. Although the differences between the GBD and the median profiles of the selected field sizes of 13 institutes were found to be almost within ±2 % in this study, as depicted in the bottom part of Figure 3, the individual disparity from the GBD of each institute's beam profiles can have significant effects on beam models and calculated patient treatment plans, especially for SRS and SBRT plans as reported in published data from different groups.[32,33] A closer look at the result of institute number 12 regarding OCR parameters having a large disparity in comparison to the findings of another institute that used the same detector shows that the observed variations from GBD o are not solely due to the detector type, which is suitable for small field dosimetry, but the positioning problem can also be addressed as a potential source of error while measuring the profile for evaluated field sizes.
The selection of detectors is a crucial step in small field output factor measurements as the size of the detector and the material of the central electrode can significantly affect the accuracy of the readings. Inaccurate measurements can lead to under or overestimated readings, resulting in imprecise monitor unit (MU) calculations in the patient's treatment plan. As summarized in TG155,[31] the absorbed dose for small fields measured by ion chambers is highly dependent on their density, with high-density chambers resulting in overresponse and low-density detectors under-response that the comparison of measurements taken by at least two suitable detectors is recommended to ensure for accurate dose determination for small field sizes under 30×30 mm2. The majority of the participant institutes in this study were carried out with the use of ion chambers for OF measurements; however, the GBD's OF values that were given by the vendor were measured with a diode. As was to be expected and reported in the literature,[15] the OF values measured and determined using the ion chamber was lower than the OF values obtained for almost all of the field sizes using the diode (PTW 60008 Diode) having a higher density than water which is employed for the GBD measurements. During TPS modelling, it is important to consider that the difference between the OF values measured with an ion chamber and the OF of GBD measured with a diode may be due to diode density. There is an agreement with a 2% deviation between the uncorrected OFs and their relative difference from the uncorrected OFs of the GBD for field sizes >20×20 mm2, except for the OF values measured using the CC04 ion chamber, which has the largest volume because the larger the volume of the detector, the smaller the output factor.
Despite the fact that all detectors used by 13 institutes were suitable for collecting beam data with field sizes ranging from 20×20 to 50×50 mm2 in this study when the OF values were corrected by output correction factors, the variations from GBD values were greatly reduced, with the maximum variation of OF measured with an A16 microchamber, which has the smallest volume, observed at field size 20×20 mm2 due to detector-dependent behavior. In this investigation, the electrode of the Exradin A16 microchamber is comprised of materials with silver-plated coppercovered steel, which has a higher atomic number than other microchambers, which predominantly contain Al (Z:13). The overresponse of the A16 microchamber OF value can be explained by the high effective atomic number of the electrode, which increases the probability that electrons will be created, thereby contributing to a higher dose in the smaller ion chambers that contain the higher-Z central electrode.
However, the variation of the OF even same model of a detector has large variations after applying the correction factors tabulated in Table 5 to minimize the detector-specific effect may not be explained only by the detector selection of each institute, machinespecific or user-related uncertainties, the correction factors can affect the dispersion of the value as stated in the paper published by Dufreneix et al.[34] Similar to their data collecting among multicenter, the output factor measurements done by participants in this study were not conducted in the conditions recommended in the IAEA TRS 483 (SSD =90 cm and depth =10 cm), and the correction factor derived from TRS 483 determined for the irradiation field size was utilised directly to correct the output factor measured for the physical field size. Consequently, these limitations of this investigation could explain the disparity in OFcorr.
In addition to the detector effect on beam collection measurements, it should be considered that differences in the type of dosimetry equipment, including the water phantom, reference chamber for scanning data used by each institute, and set-up of the equipment can affect OCR parameters such as FWHM and penumbra, which can cause uncertainty in the study. Although the detector difference used during the measurements in the study is wide, the absence of solid state detectors such as diode or diamond and the number of participant institutes which is 13 in this study can be considered other limitations of the present study the median data of the 6 MV FFF small field measurements may not be sufficient to use as an alternant to GBD supplied by the vendor. Despite the existence of a few multicenter studies for small area measurements and even national campaigns,[34] there is currently no published data of a Turkish multicentric study in the literature focusing on the effect of the detector used for beam data collecting for small fields of FFF beams.
Although the GBD has been clinically used worldwide and can be used as good reference data, we also generated the median data for 6 MV FFF small fields from participant Versa HD users, which includes interuser and detector-dependent variations to account for possible differences in commissioning measurements, which will aid in the as a supplementary verification tool for Versa HD users to validate their TPS measurements prior to clinical implementation.
Conclusion
To assess the current status of reference dosimetry and small-field dosimetry in clinical practice, a collaborative comparison study involving several dosimetry methods was performed by Elekta Versa HD users at thirteen institutes. A comparison of dosimetry methods at different clinics, even if the clinical beam commissioning measurements closely match the GBD, can be used as a means to uncover systematic uncertainties in radiotherapy. The present multicenter analysis was promoted to increase knowledge sharing amongst different clinics in Turkey that are users of the Versa HD and Monaco TPS and to design the basis for future inter-clinical SRS and SBRT studies. In future projects, it is aimed to investigate the effects of beam modelling differences on the clinical applications of SRS and SBRT. This study underlines that in order to offer accurate TPS modelling of small fields and minimize the uncertainty of SRS and SBRT, the use of several dosimetric systems, comparison of golden beam data, and multi-institutional review are required.Peer-review: Externally peer-reviewed.
Conflict of Interest: All authors declared no conflict of interest.
Financial Support: None declared.
Authorship contributions: Concept - C.C.; Design - C.C., B.G., A.Y., S.G.; Supervision - C.C., B.G., A.Y., S.G.; Materials - C.C., B.G., A.Y., S.G., S.Y.İ., E.K., Ö.Ö., A.K., V.A., T.B., T.U., Y.S., S.C., İ.F.D.; Data collection and/or processing - C.C., B.G., A.Y., S.G.; Data analysis and/or interpretation - C.C., B.G., A.Y., S.G.; Literature search - C.C., B.G., A.Y., S.G.; Writing - C.C.; Critical review - C.C., B.G., A.Y., S.G.
References
1) Das IJ, Ding GX, Ahnesjö A. Small fields: Nonequilibrium
radiation dosimetry. Med Phys 2008;35:206-15.
2) International Atomic Energy Agency. Dosimetry
of Small static fields used in external beam radiotherapy.
Technical report series No. 483. Vienna:
International Atomic Energy Agency. Available at:
http://www-pub.iaea.org/books/IAEABooks/11075/
Dosimetry-of-Small-Static-Fields-Used-in-External-
Beam-Radiotherapy.2017. Accessed Oct 27, 2023.
3) Sarkar V, Wang B, Zhao H, Lynch B, James JA, McCullough
KT, et al. Percent depth-dose distribution discrepancies
from very small volume ion chambers. J
Appl Clin Med Phys 2015;16(2):5230.
4) Lechner W, Wesolowska P, Azangwe G, Arib M, Alves
VGL, Suming L, et al. A multinational audit of small
field output factors calculated by treatment planning
systems used in radiotherapy. PhiRO 2018;5:58-63.
5) Khoei S, West M, Kairn T. Measurement of percentage
depth-dose profiles in very small fields. In: Lhotska
L, Sukupova L, Lackovi? I, Ibbott G (editors). World
Congress on Medical Physics and Biomedical Engineering
2018. Singapore: IFMBE Proceedings, vol 68/3; Springer.
6) ICRU. Small Field Dosimetry. J ICRU Meas
2014;14(2):31-53.
7) Yamamoto T, Teshima T, Miyajima S, Matsumoto M,
Shiomi H, Inoue T, et al. Monte Carlo calculation of
depth doses for small field of CyberKnife. Med Imaging
Radiat Oncol 2002;20(6):305-10.
8) Gersh JA, Best RC, Watts RJ. The clinical impact of detector
choice for beam scanning. J Appl Clin Med Phys
2014;15(4):4801.
9) Cho W, Kim S, Kim J, Wu H, Jung J, Kim M, et al.
Dosimetric effects on small-field beam-modeling for
stereotactic body radiation therapy. J Korean Phys Soc
2015;66:678-93.
10) Kawahara D, Ozawa S, Nakashima T, Aita M, Tsuda S,
Ochi Y, et al. Evaluation of beam modeling for small
fields using a flattening filter-free beam. Radiol Phys
Technol 2017;10:33-40.
11) Azzi A, Ryangga D, Pawiro SA. The characteristics of
small field beam quality and output factor of 6 MV
FFF. J Phys Conf Ser 2019;1248:012056.
12) Vassiliev ON, Titt U, Pönisch F, Kry SF, Mohan R,
Gillin MT. Dosimetric properties of photon beams
from a flattening filter-free clinical accelerator. Phys
Med Biol 2006; 51(7):1907-17.
13) Titt U, Vassiliev ON, Pönisch F, Dong L, Liu H, Mohan
R. A flattening filter-free photon treatment
concept evaluation with Monte Carlo. Med Phys
2006;33(6):1595-602.
14) Cashmore J. The characterization of unflattened photon
beams from a 6 MV linear accelerator. Phys Med
Biol 2008;53:1933-46.
15) Lechner W, Palmans H, Sölkner L, Grochowska P,
Georg D. Detector comparison for small field output
factor measurements in flattening filter free photon
beams. Radiother Oncol. 2013;109(3):356-60.
16) Akino Y, Mizuno H, Tanaka Y, Isono M, Masai N,
Yamamoto T. Inter-institutional variability of smallfield-
dosimetry beams among HD120? multileaf collimators:
A multi-institutional analysis. Phys Med Biol
2018;63(20):205018.
17) Das IJ, Cheng CW, Watts RJ, Ahnesjö A, Gibbons J,
Li XA, et al. Accelerator beam data commissioning
equipment and procedures: report of the TG-106 of
the Therapy Physics Committee of the AAPM. Med
Phys 2008;35(9):4186-215.
18) IAEA. Absorbed dose determination in external beam
radiotherapy. Technical Report Series No. 398. Vienna:
IAEA; 2000.
19) Griessbach I, Lapp M, Bohsung J, Gademann G, Harder
D. Dosimetric characteristics of a new unshielded silicon
diode and its application in clinical photon and
electron beams. Med Phys 2005;32:3750-4.
20) Aspradakis MM, Byrne JP, Palmans H, Duane S, Conway
J, Warrington AP, et al. IPEM report 103: Small
field MV photon dosimetry (IAEA-CN--182). International
Atomic Energy Agency 2010;42(14):3-644.
21) Wegener S, Sauer OA. The effective point of measurement
for depth-dose measurements in small MV
photon beams with different detectors. Med Phys
2019;46(11):5209-15.
22) Fogliata A, Garcia R, Knoos T, Nicolini G, Clivio A,
Vanetti E, et al. Definition of parameters for quality assurance
of flattening filter free (FFF) photon beams in
radiation therapy. Med Phys 2012;39(10):6455-64.
23) Palmans H, Andreo P, Huq MS, Seuntjens J, Christaki
KE, Meghzifene A. Dosimetry of small static fields
used in external photon beam radiotherapy: Summary
of TRS-483, the IAEA-AAPM international Code of
Practice for reference and relative dose determination.
Med Phys 2018;45(11):e1123-45.
24) Casar B, Gershkevitsh E, Mendez I, Jurkovi? S, Saiful
Huq M. Output correction factors for small static
fields in megavoltage photon beams for seven ionization
chambers in two orientations - perpendicular and
parallel. Med Phys 2020;47(1):242-59.
25) Benmakhlouf H, Sempau J, Andreo P. Output correction
factors for nine small field detectors in 6 MV radiation
therapy photon beams: a PENELOPE Monte
Carlo study. Med Phys 2014;41(4):041711.
26) Durmuş İF, Atalay ED. Output measurements of
monte carlo, collapse cone and pencil beam algorithms
in homogeneous and inhomogeneous phantom.
J Adv Res Nat Appl Sci [Article in Turkish]
2019;5(2):251-60.
27) Scott AJ, Nahum AE, Fenwick JD. Using a Monte Carlo
model to predict dosimetric properties of small radiotherapy
photon fields. Med Phys 2008;35:4671-84.
28) Andreo P. The physics of small megavoltage photon
beam dosimetry. Radiother Oncol 2018;126(2):205-13.
29) Godson HF, Ravikumar M, Sathiyan S, Ganesh KM,
Ponmalar YR, Varatharaj C. Analysis of small field
percent depth dose and profiles: Comparison of measurements with various detectors and effects of detector
orientation with different jaw settings. J Med Phys
2016;41(1):12-20.
30) Mamballikalam G, Senthilkumar S, Jayadevan PM,
Jaon Bos RC, Basith PMA, Inippully R, et al. Evaluation
of dosimetric parameters of small fields of
6 MV flattening filter free photon beam measured
using various detectors against Monte Carlo simulation
? CORRIGENDUM. J Radiother Pract
2021;20(3):369.
31) Das IJ, Francescon P, Moran JM, Ahnesjö A,
Aspradakis MM, Cheng CW, et al. Report of AAPM
Task Group 155: Megavoltage photon beam dosimetry
in small fields and non-equilibrium conditions. Med
Phys 2021;48(10):e886-921.
32) Pappas E, Maris TG, Zacharopoulou F, Papadakis A,
Manolopoulos, Green S, et al. Small SRS photon field
profile dosimetry performed using a PinPoint air ion
chamber, a diamond detector, a novel silicon-diode array
(DOSI), and polymer gel dosimetry. Analysis and
intercomparison. Med Phys 2008;35(10):4640-8.