


Summary
OBJECTIVEThe aim of this study was to explore differences in image quality between PET/MR and PET/CT hybrid imaging systems using standard quality control and National Electrical Manufacturers Association (NEMA) tests.
METHODS
Image acquisition and quality control tests were investigated according to the standards of NEMA NU
2-2007 using NEMA phantom and recommended image acquisition techniques. The phantom consists
of lesion-like hot spheres of diameters 10, 13, 17, and 22 mm filled with 8:1 18F activity ratio to background.
The remaining 28 and 37 mm cold spheres were filled with water only. A 700-mm linear line
source was prepared with 3.08 mCi (140.6 MBq), and all essential ROIs were drawn after image acquisition
to calculate contrast.
RESULTS
In PET/MR, the average contrast of 10, 13, 17, and 22 mm diameter hot spheres in the phantom was 56%,
72%, 78%, and 85%, respectively. While the contrast of 10, 13, 17, and 22 mm diameter hot spheres in
PET/CT was 53%, 66%, 72%, and 79%, respectively.
CONCLUSION
PET/MR image contrast was higher than PET/CT by 9%.
Introduction
Positron Emission Tomography Integrated Magnetic Resonance (PET/MR) imaging technique has been considered a pivotal development in hybrid imaging and nuclear medicine. PET/CT is routinely used in the detection of primer and metastatic lesions in cancer, evaluation of response after treatment, staging, and radiotherapy planning. In PET/MR, images with high contrast and improved spatial resolution combined with cancer-specific sensitivity of PET radiopharmaceuticals aid clinicians to recognize and diagnose oncological diseases.[1,2]One of the most effective factors for PET/MR and PET/CT image quality is photon attenuation correction method. The attenuation correction coefficients for PET/CT images are obtained from CT map derived from images of the patient. This process is performed in several ways using different methods in PET/MR, which most commonly include attenuation correction algorithms using MR-based images; another method is using attenuation coefficients obtained from standard human phantom CT images.[3]
Conventional photon multiplier tubes (PMTs) of the PET model have been replaced with nonmetallic PMTs to prevent MR effect on the ferromagnetic objects inside the PET/MR gantry. The most common semiconductor detectors are silicon photomultipliers (SiPM) and avalanche photodiodes (APD). Semiconductor material detectors are superior to PMTs in terms of signal efficiency.[4] Therefore, PMTs in PET/ CT have been recently equipped with semiconductor detectors like SiPMT and APD. Some studies reported that the signal detection and resolving time of SiPMs are better than the other semiconductor detector.[5]
National Electrical Manufacturers Association (NEMA) test standards for PET scanners were last renewed in 2007. One of the NEMA tests recommended for PET is given a title of "image quality." In the image quality test, NEMA IQ phantom is used to measure the contrast of the lesions of hyperactive, hypoactive, and lung-like object of the phantom.[6] Comparison of contrast measurements obtained in standard conditions can be used to determine image quality differences between devices.[7]
The aim of this study was to compare image qualities in PET/MR and PET/CT devices, with identical properties of PET modules, using standard quality control phantoms and the standard method (NEMA method).
Methods
Imaging systems: In this study, both imaging devices that underwent NEMA image quality tests are products of the same company with Time of Flight (TOF) PET. PET/MR is a General Electric brand/SIGNATM model equipped with a SiPM detector. PET/CT is a General Electric brand/Discovery 690 model, with metallic PMT.NEMA IQ (body) phantom: According to NEMA NU 2-2007 standards, the image quality of PET scanners is made with Standard NEMA image quality phantom.[7]
The objects adhered in the phantom of image quality imitate the human head, and the polyethylene scattering phantom is attached to the tip of the phantom simulating the lower body trunk. The phantom is made of plexiglas material with water equivalent-attenuation coefficient (1.18 g/cm³), comprising different sizes of spheres. The low-density pipe (0.3 g/cm³) in the middle filled with styrofoam represents the lungs. The inner diameters of the six fillable spheres are 10, 13, 17, 22, 28, and 37 mm (Fig. 1).
;)
Fig 1: PET IQ (body) phantom (on the left) and scatter phantom (on the right).
Phantom Preparation and Imaging: The room in the phantom was filled with 18F mixed with water at a homogeneous concentration of 0.14 µCi/ml (5.18 kBq/ ml). Hot spheres activity ratio might be 8:1 to background. Two large spheres of 28 and 37 mm diameters were filled with water for cold lesion imaging, and the other spheres were filled with 18F at a concentration of 1.12 µCi/ml (41.44 kBq/ml). The line source is prepared with 5 mCi (185 MBq) 18F and inserted in the polyethylene phantom. The phantoms were placed over patient"s bed after filling and then imaged for 30 min (Fig. 2). Photon attenuation correction of PET/MR images was achieved with 4 class-Dixon algorithm. PET/ CT reconstruction was performed using the OSEM algorithm.
;)
Fig 2: Positioning of polyethylene (scatter) phantom and body phantom (NEMA IQ) for imaging.
NEMA Image Quality Parameters: According to NEMA NU 2007 protocol, two necessary parameters in the quality of PET images should be evaluated: contrast and background variability. Lesion contrast estimation was performed using equations 1 and 2.[6]
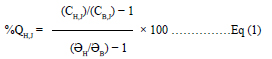
CH,J = j average counts of hot sphere"s ROI
CB,J = j average counts of backgraund"s ROIs drawn for
hot sphere
aH = Hot sphere"s activity concentration
aB = Backgraund"s activity concentration
The contrast value for spheres without radioactivity
was calculated using equation.[2]
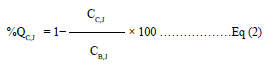
CC,J = Average ROI counts within background spheres
CB,J = Average ROI counts for all background spheres
During analysis, all hot and cold spheres located in transverse sections were involved by drawing circular ROIs on the outer contour of each sphere. For background determination, 12 ROIs were drawn outside the hot and cold spheres.
Results
Regarding PET/MR system, which depends on MRbased attenuation correction, the contrast values for the 10, 13, 17, and 22 mm diameter hot spheres of NEMA IQ phantom and the limit values given by the manufacturer to these lesions are shown in (Table 1). The images of NEMA IQ phantom taken under the same conditions in PET/MR and PET/CT are shown in (Fig. 3).;)
;)
Contrast values for background ROIs were found as 8%, 6%, 5%, 5%, 6%, and 6%. The error value for lung tissue remaining activity was measured as 1.2%. The limit error rate given by the manufacturer is 10%.
The contrast values for the 10, 13, 17, and 22 mm diameter hot spheres of NEMA IQ phantom in PET/ CT with CT-based attenuation correction in addition to the limit values given by the manufacturer to these lesions are shown in Table 1. The contrast values for background ROIs were 11%, 7.2%, 6.1%, 4.1%, 3.8%, and 3%. The error value for lung tissue remaining activity was measured as 12.2%. The limit error rate was 20%, as given by the manufacturer.
Discussion
In this study, PET/CT using CT-based attenuation correction and PET/MR using MR-based attenuation correction were imaged and evaluated using standard NEMA IQ phantom. The PET detectors in PET/MR are attached to SiPM, and the sensitivities of these detectors are known to be better than PM of PET/CT.[7] System sensitivity has a great importance on the amount of radiopharmaceutical activity routinely administered to the patient. This means that sensitivity of the PET/MR is higher and consequently the amount of activity used is lower. In addition, CT-based attenuation correction is not applied in PET/MR and therefore the radiation tomodose, to which the patient may be exposed, is significantly negligible.[8]Standard uptake value values of the lesions were compared using PET/MR and PET/CT images obtained under equal conditions; statistical significance was not found between the results.[9] In another study, PET/ MR and PET/CT modalities were compared in lung lesion detection, and there was no significant difference between the two systems.[10] Paspulati et al. compared the images of PET/MR and PET/CT in patients suffering from colorectal cancers and reported that diagnostic accuracy was superior in PET/MR images.[11] Riola-Parada et al. proposed a review of a total of 57 clinical results using PET/MR and PET/CT stating that the diagnostic value of PET/MR images was generally similar to that of PET/CT, but PET/CT images showed outstanding detectability of lung nodules.[12] In light of literature data, it is obvious that the PET/MR imaging system is still a new modality compared with others, and therefore standard properties and functioning of PET/ MR are still controversial and need further studies.
MR-based (Dixon) and CT-based attenuation correction algorithms have been used to acquire NEMA IQ phantom images by PET/MR. CT attenuation coefficients extracted from the standard phantom were applied again to the standard NEMA IQ phantom. The result of the study indicated that quality of the images was better with CT-based attenuation correction.[7] Because bodies of patients have different physiological characteristics, the standard attenuation coefficients obtained from phantoms may lead to inconsistent results to patient when applied on the corresponding clinical images.
In our study, NEMA IQ phantom was used. However, unlike other studies, MR-based Dixon algorithm in PET/MR and CT-based attenuation correction algorithms in PET/CT were applied for phantom imaging. Another difference of our study from other studies is that the influence of different algorithms on image quality is investigated in two different imaging systems with the same PET modules. Boellaard et al. performed a multi-center study using NEMA image quality phantom on PET/MR of three different vendors and obtained quantitative values in PET/MR. As a result of the study, it was reported that image quality differences between devices can be determined using NEMA image quality phantom in PET/MR devices.[13] Delso et al. investigated the performance measurements of PET/ MR and found no noticeable superiority in image quality compared with PET/CT.[14]
Karlberg et al. carried out NEMA tests using Siemens PET/CT with TOF and PET/MR without TOF. They reported comparable results of sensitivity, noise equivalent count rate, and lesion contrast. The performance evaluation was elevated in PET/MR because of the TOF technology.[15]
In our study, all hot lesions had a 9% higher average contrast measurement in PET/MR than in PET/ CT. These findings are thought to be due to the high efficiency of PET detectors that are attached to highquality SiPM material in PET/MR systems as well as a special type of MR-based algorithm (Dixon) for attenuation correction.
Disclosures Statement
The authors declare no conflicts of interest.
Ethics Committee Approval: This study was conducted inaccordance with local ethical rules.
Peer-review: Externally peer-reviewed.
Conflict of Interest: None declared.
Authorship contributions: Concept - .........; Design - .........; Supervision - ..........; Materials - ........; Data collection &/or processing - ..........; Analysis and/or interpretation - ........; Literature search - ..........; Writing - ..........; Critical review - ...........
References
1) Buchbender C, Heusner TA, Lauenstein TC, Bockisch
A, Antoch G. Oncologic PET/MRI, part 1: tumors of
the brain, head and neck, chest, abdomen, and pelvis.
J Nucl Med 2012;53(6):928-38.
2) Buchbender C, Heusner TA, Lauenstein TC, Bockisch
A, Antoch G. Oncologic PET/MRI, part 2: bone tumors,
soft-tissue tumors, melanoma, and lymphoma. J
Nucl Med 2012;53(8):1244-52.
3) Wagenknecht G, Kaiser HJ, Mottaghy FM, Herzog H.
MRI for attenuation correction in PET: methods and
challenges. MAGMA 2013;26(1):99-113.
4) Britvich I, Johnson I, Renker D, Stoykov A, Lorenz E.
Characterisation of Geiger-mode avalanche photodiodes
for medical imaging applications. Nucl Instrum
Methods Phys Res 2007;571(1-2):308-11.
5) Schaart DR, Seifert S, Vinke R, van Dam HT, Dendooven
P, Löhner H, et al. LaBr(3):Ce and SiPMs for
time-of-flight PET: achieving 100 ps coincidence resolving
time. Phys Med Biol 2010;55(7):N179-89.
6) National Electrical Manufacturers Association. Performance
measurements of positron emission tomodose graphs. EMA Standards Publication NU 2-2007. Rosslyn,
VA: 2007.
7) Ziegler S, Jakoby BW, Braun H, Paulus DH, Quick HH.
NEMA image quality phantom measurements and
attenuation correction in integrated PET/MR hybrid
imaging. EJNMMI Phys 2015;2(1):18.
7) Vandenberghe S, Marsden PK. PET-MRI: a review
of challenges and solutions in the development of
integrated multimodality imaging. Phys Med Biol
2015;60(4):R115-54.
8) Sher AC, Orth R, McClain K, Allen C, Hayatghaibi
S, Seghers V. PET/MR in the Assessment of Pediatric
Histiocytoses: A Comparison to PET/CT. Clin Nucl
Med 2017;42(8):582-8.
9) Sachpekidis C, Hillengass J, Goldschmidt H, Mosebach
J, Pan L, Schlemmer HP, et al. Comparison of
(18)F-FDG PET/CT and PET/MRI in patients with
multiple myeloma. Am J Nucl Med Mol Imaging
2015;5(5):469-78.
10) Rauscher I, Eiber M, Fürst S, Souvatzoglou M, Nekolla
SG, Ziegler SI, et al. PET/MR imaging in the detection
and characterization of pulmonary lesions: technical
and diagnostic evaluation in comparison to PET/CT. J Nucl Med 2014;55(5):724-9.
11) Paspulati RM, Partovi S, Herrmann KA, Krishnamurthi
S, Delaney CP, Nguyen NC. Comparison
of hybrid FDG PET/MRI compared with PET/CT in
colorectal cancer staging and restaging: a pilot study.
Abdom Imaging 2015;40(6):1415-25.
12) Riola-Parada C, García-Cañamaque L, Pérez-Dueñas
V, Garcerant-Tafur M, Carreras-Delgado JL. Simultaneous
PET/MRI vs PET/CT in oncology. A
systematic review. Rev Esp Med Nucl Imagen Mol
2016;35(5):306-12.
13) Boellaard R, Rausch I, Beyer T, Delso G, Yaqub M,
Quick HH, et al. Quality control for quantitative multicenter
whole-body PET/MR studies: A NEMA image
quality phantom study with three current PET/MR
systems. Med Phys 2015;42(10):5961-9.